
QC Managers can monitor Responsible Party/Subcontractors QC Performance, including number of QC items, amount of time it takes to fix deficiencies, recurring issues and more.
- NEW! The dashboard filters are "sticky," meaning it will remember the filters you selected the next time you return to the screen. "Sticky" filters are cleared and defaults reset when you close the browser or logout of FTQ360.
Video Overview (4:30)
Instructions
1. Go to: Inspection > Responsible Party Performance Dashboard.
2. Dashboard Overview
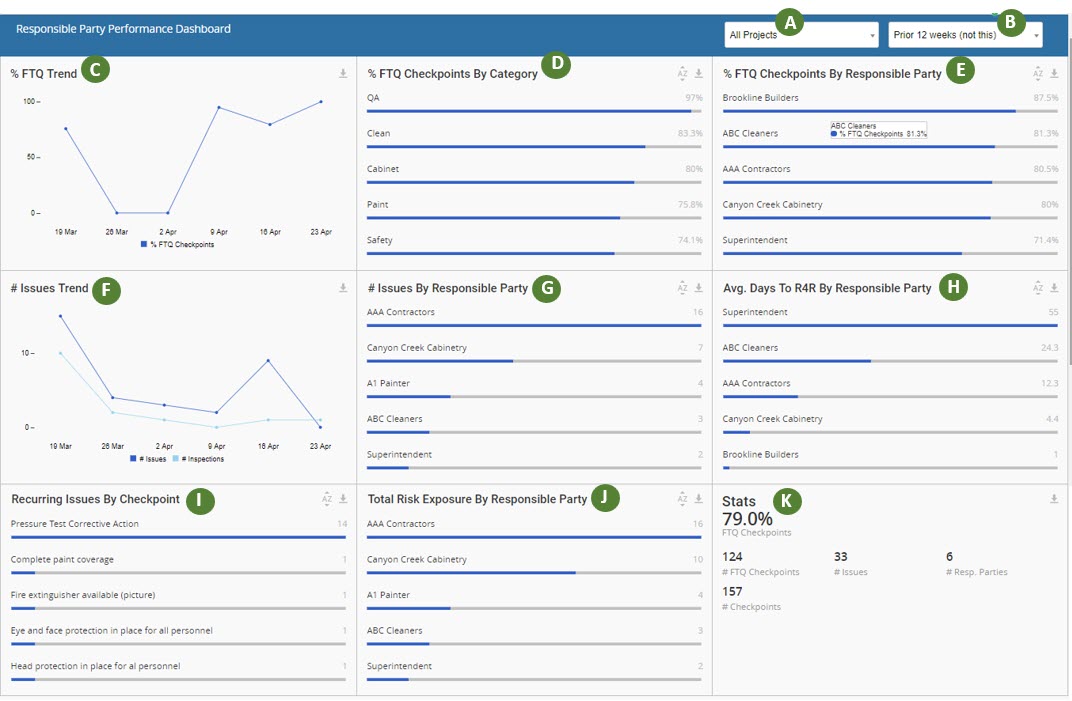
A. Project Drop Down - Use this drop down menu to filter the dashboard by all or one specific project.
B. Time Frame Drop Down - Use this drop down menu to filter the dashboard by a pre-set date range.
C. % FTQ Trend - This line graph displays the percentage of checkpoints marked FTQ compared within a specified date. Hover over a data point on the graph for a numeric value.
D. % FTQ Checkpoints by Category - This bar graph ranks checkpoints based on the number marked FTQ during inspections within the time frame. Click the AZ icon to reverse the ranking.
E. % FTQ Checkpoints by Responsible Party - This bar graph ranks Responsible Parties based on the number of checkpoints marked FTQ during inspections within the time frame. Click the AZ icon to reverse the ranking.
F. # Issues Trend - This line graph compares the number of issues to the number of inspections within a specified date. Hover over a data point on the graph for a numeric value.
G. # Issues by Responsible Party - This bar graph ranks Responsible Parties based on the number of issues within the time frame. You can see at a glance who has the most issues in their work, and who has the least. Click the AZ icon to reverse the ranking.
H. Average Days to R4R by Responsible Party - This bar graph displays the average number of days a Responsible Party is taking to update an Open Item to Ready for Review, or basically how long it's taking to fix deficiencies. The chart ranks Responsible Parties based on the number of days. Click the AZ icon to reverse the ranking.
I. Recurring Issues by Checkpoint - This bar graph ranks checkpoints based on the number of issues within the time frame. You can see at a glance which checkpoints produce the most issues, and which produce the least. Click the AZ icon to reverse the ranking.
J. Total Risk Exposure by Responsible Party - This bar graph ranks Responsible Parties based on the number of issues with the highest risk factor numbers. Risk Factor is given by the inspector during an inspection.
K. Stats - This section lists the basic data used to compile the charts.
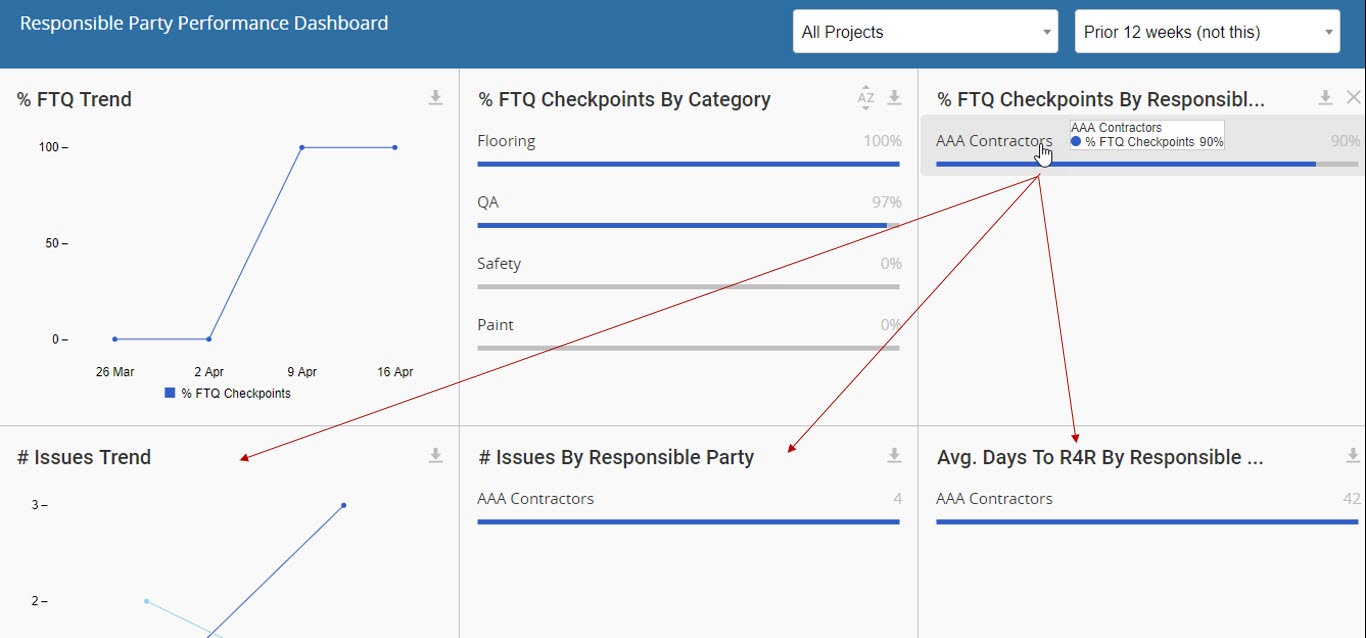
3. Select a specific Category, Checklist, or Responsible Party to focus the graphs and data on that subject matter. To return to an unfiltered display, click the "X" in the upper right corner of the section box.
4. Dashboard Data Downloads: You can download the data displayed on your dashboard screen.
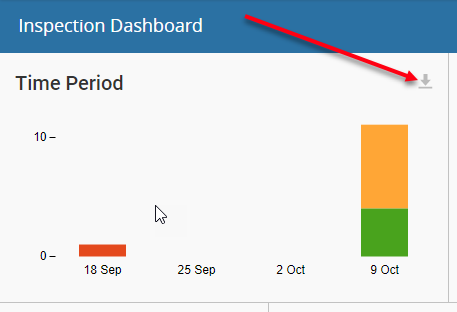
Click the small download icon on the top right-hand side of each chart area and a CSV file of the underlying data is downloaded. This makes it easy to copy the data and use it in other spreadsheets, reports and management dashboard software.
5. Dashboard Filters: Dashboard filters make it easy to provide different combinations of data.
- Apply Dashboard Filters: Click a data source (Project, Phase, Inspector, Responsible Party, etc.) to recalculate the dashboard data to display just the information pertaining to that source. You can choose multiple sources to keep mining deeper into the data (Project Name + Phase + Responsible Party.) For example, if you want to only see information pertaining to a single inspector, click the inspector’s name to filter the dashboard by that inspector. If you want to see that inspector’s activity in a specific project, click the inspector’s name then click the project name.
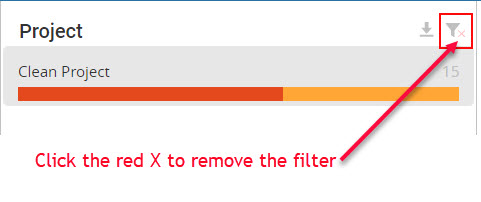
- Remove Dashboard Filters: You can remove dashboard filter by clicking the red “X” next to the filter icon in the upper right hand corner of the data box. (If the icon isn't displaying correctly, you may need to clear the browser cache.)
Comments
0 comments
Please sign in to leave a comment.