
With this new dashboard you can analyze deficiency trends over time to see if the backlog of open issues is growing or shrinking.
Instructions:
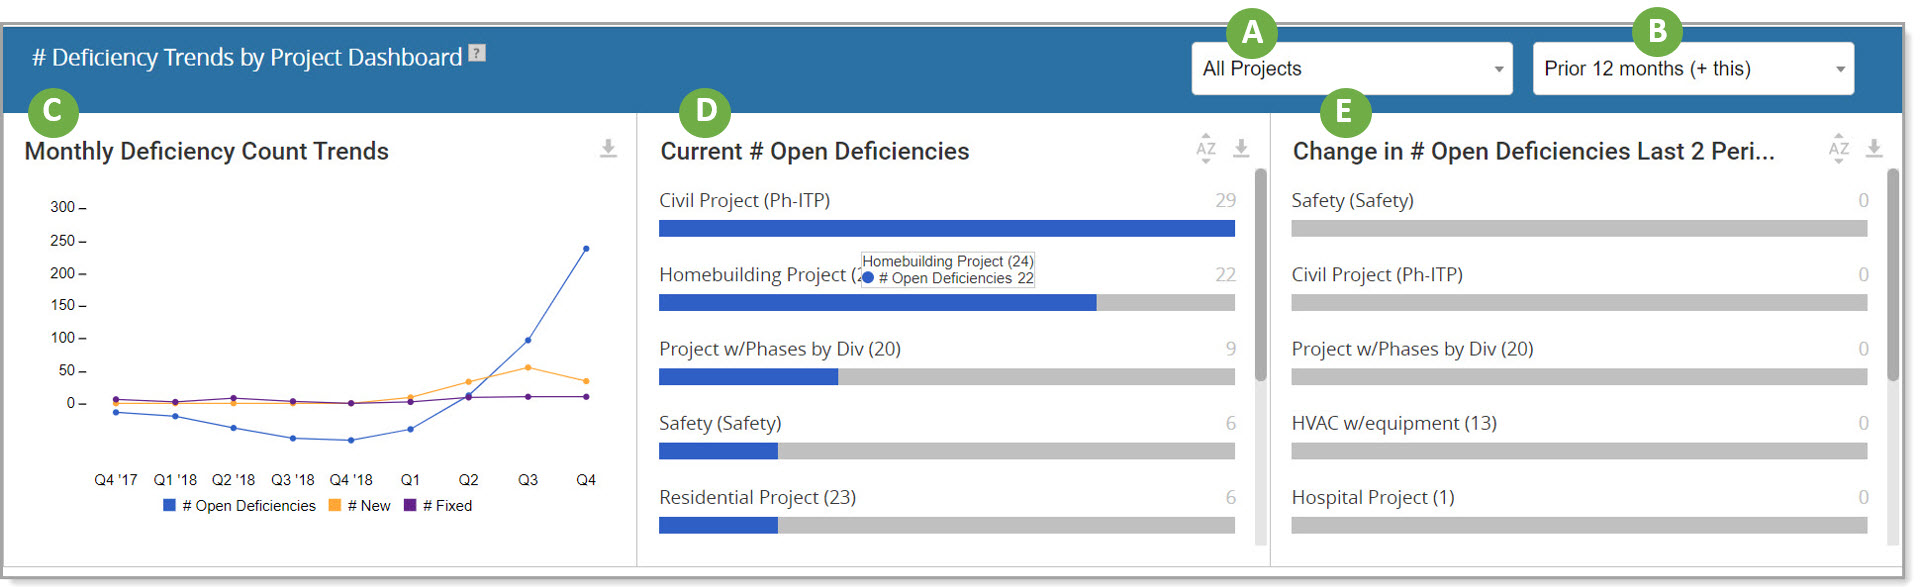
A. Project Filter: Use this drop down to select one specific project or all projects.
B. Date Range Filter: Time periods include "This month (until now)" and "Last month (only)" shown weekly on the trend graph, "Prior 12 months (not this)" shown monthly, and "Prior 12 months (+this)" shown quarterly.
C. Monthly Deficiency Count Trends: This first panel displays a 3-line trend graph depicting trends over the selected time frame for all open deficiencies, fixed/QC items and new open deficiencies. .
D. Current # Open Deficiencies: This section displays current number of Open Items by project. The list can be sorted by highest to least or least to highest and is useful for seeing which projects have the most or least issues overall..
E. Change in # Open Deficiencies Last 2 Periods: This section displays change in the number of Open Deficiencies over the last two periods, which is the change in the number of Open Items last month (vs. prior month).
For continuity purposes, the deficiency data on this dashboard is based on the inspection date not the date the deficiency was created if different than the inspection date. Deficiencies added to an inspection a month or more after the inspection was created may not appear on this dashboard.
Comments
0 comments
Please sign in to leave a comment.