
With this dashboard you can analyze the number of deficiencies by Reason Code(s) from highest to lowest over a selected time period and identify the checklist(s) and checkpoints from which they were selected.
Instructions:
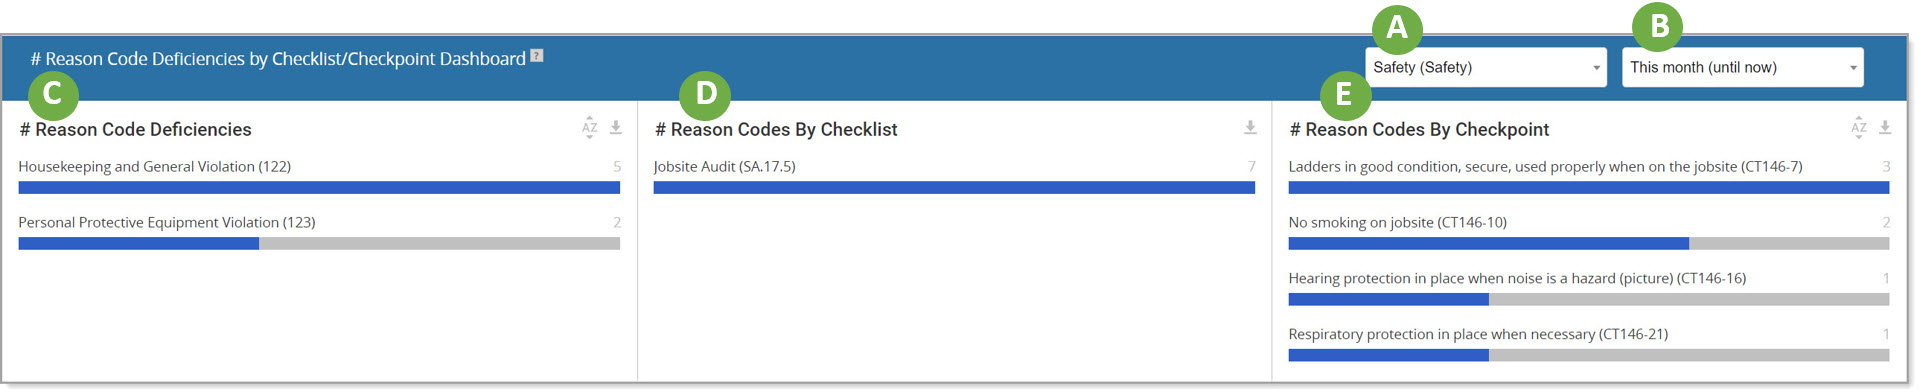
A. Project Filter: Use this drop down to select one specific project or all projects.
B. Date Range Filter: Time periods include "This month (until now)" and "Last month (only)" shown weekly on the trend graph, "Prior 12 months (not this)" shown monthly, and "Prior 12 months (+this)" shown quarterly.
C. # Reason Code Deficiencies: This first panel displays the number of deficiencies (OPN and FIXED/QC) based on assigned reason code(s).
D. # Reason Code by Checklist: This section displays the checklists from which the reason codes were selected and the number of deficiencies per checklist.
E. # Reason Code by Checkpoint: This section displays the checkpoints from which the reason codes were selected along with the number of deficiencies per checkpoint.
For continuity purposes, the deficiency data on this dashboard is based on the inspection date not the date the deficiency was created if different than the inspection date. Deficiencies added to an inspection a month or more after the inspection was created may not appear on this dashboard.
Comments
0 comments
Please sign in to leave a comment.