
SEPTEMBER/OCTOBER/NOVEMBER 2019
Release date is 12/9/2019
INSPECTIONS
- Inspection date editable by inspector: The "Inspection Date" shown on reports, dashboards, and query filtering criteria can now be changed by users with "Overwrite/Delete" permissions. To change the "Inspection Date, you will edit the "Inspection created on" date in the blue header at the top of the inspection. Just click on the "Inspection created on" date and select the date from the popup calendar date picker. Date changes with the new date are recorded on activity log and the revised date will then appear as the inspection date where applicable. Changing the "Inspection created on" date will not change the Deficiency/Open item dates on the inspection.

- Weather report insert: Get the current NOAA weather forecast inserted into your checkpoint notes field(s). Just put your cursor in the "Enter Observation" notes field and select the "sun" icon. You'll get the forecast, temperature, wind speed and direction, date and time. Your GPS location is required for the weather feature to work. Thus, you'll first want to make sure "Enable GPS Picture Marking" is checked in Account Management (Setup > Administration > Account Management) and allow FTQ360 to use your location when asked by your device. If you do not want the weather feature turned on, you can go to Setup > Customization Preferences > search for "weather" and change the preference from "1" Use weather to "0" Do not use weather.


- Checkpoint Reference Image Attachments: Markup & Insert on Inspection Reports: Reference images can now be opened and marked up with the photo editor and saved to the checkpoint to be part of your inspection. Use the "Paperclip" icon to attach your reference image(s) in Setup. [Setup > Checklist Setup > Checkpoint]. When doing an inspection with a checkpoint reference attachment, click on the reference toggle arrow to see the reference image. Next, click on the reference image to open it. Once opened, the image behaves the same as if it were a photo you took or selected from your camera roll. You can use the photo editor to markup the reference image and save your marked up image to the checkpoint to become part of the inspection report.

- Matrix: Drag and Drop to Move Row Up/Down - We're continuing to refine the functionality of our matrices. Matrices are very good for the more technical requirements of adding test data to rows in a matrix or table format. The drag and drop row up/down feature lets inspectors change the order of matrix rows as needed. To use this feature click or press and begin moving the row. It will change color once you start to move the row. Let go to place.

- Matrix: Copy Row to New Row - "Copy Any Row" or "Copy Last Row" You can set a preference for your account to choose "enabled on last row" which copies/duplicates the last row, or "enable on all rows", which allows copying of any row to the last row. Go to Setup > Customization Preferences. Search "Copy" and choose the appropriate selection. No copying is enabled by default.


DASHBOARDS
- 3 New Deficiency Dashboards:
- Open Deficiency Trends by Project;
- Reason Code Deficiencies by Reason/Correction Trends;
- Reason Code Deficiencies by Checklist and Checkpoint

- Open Deficiency Trends by Project - With this new dashboard you can analyze deficiency trends over time to see if the backlog of open issues is growing or shrinking. This is a 3-panel dashboard with the first panel displaying a 3-line trend graph. Here, you’ll see trends over time for all open deficiencies, fixed/QC items and new open deficiencies. The second panel displays Current # Open Items by Project and the third panel displays Change in # Open Deficiencies Last 2 Periods, which is the change in #Open Items last month (vs. prior month). Time periods include "This month (until now)" and "Last month (only)", "Prior 12 months (not this)", and "Prior 12 months (+this)". For continuity purposes, all deficiencies on the panels are based on inspection date, not the date the deficiency was created if created in a subsequent month.
- Reason Code Deficiencies by Reason/Correction Trends - With this dashboard you can analyze deficiency trends based on the number of deficiencies by Reason Code(s) over time. This is a 3-panel dashboard with the first panel displaying a trend graph of the number of deficiencies (OPN and FIXED/QC) based on assigned reason code(s) by month. The second panel displays the number of deficiencies for each reason and the third panel displays the number of deficiencies for each corrective action. Choose a single reason in panel #2 and then panel #3 will display # of deficiencies for each corrective action associated with the selected reason in panel 2. Time periods include "This month (until now)" and "Last month (only)", "Prior 12 months (not this)", and "Prior 12 months (+this)".Deficiencies dates are based on the inspection date, not the date the deficiency was created.


- Reason Code Deficiencies by Checklist/Checkpoint - With this dashboard you can analyze the number of deficiencies by Reason Code(s) from highest to lowest over a selected time period and identify the checklist(s) and checkpoints from which they were selected. This is a 3-panel dashboard with the first panel displaying the number of deficiencies (OPN and FIXED/QC) based on assigned reason code(s). The second panel displays the checklists from which the reason codes were selected and the number of deficiencies per checklist. The third panel displays the checkpoints from which the reason codes were selected along with the number of deficiencies per checkpoint. Time periods include "This month (until now)" and "Last month (only)", "Prior 12 months (not this)", and "Prior 12 months (+this)". Deficiency dates are based on the inspection date, not the date the deficiency was created.

SETUP
- Transfer Assets Between Projects - The New Asset/Equipment Setup screen lets you manage all of your Assets from one screen. "Assets" refers to machinery or apparatus that can be moved from one location or project to another. Examples include cranes, heavy equipment such as front loaders, or any type of rental units. "Equipment" refers to machines or devices that do not move. Once installed, they remain in the same location or project. An example of "Equipment" would be a boiler or cooling tower. On this new Asset/Equipment setup page, you can add new assets and/or equipment and assign to a project. Once a piece of Equipment has been assigned to a Project, it cannot be moved or re-assigned to another Project. Assets, along with documents and attachments such as maintenance logs can be moved or reassigned to other projects. All Assets and Equipment on the Asset/Equipment Setup screen will also display under the "Project Equipment" area on the Project to which they are assigned. There's also an Assignment History page for Asset (not Equipment) so you can see a log of assignment changes made over time. To use this new feature, Go to Setup > Asset/Equipment Setup. As with most terms in FTQ360, you can change "Asset" and/or "Equipment" to whatever makes sense for your company. Go to Setup > Customizations > Customization Preferences.

- More Mandatory Options: We've expanded Mandatory Options to include: All checkpoint types including Data and Image; Attachments (using camera icon including Signature); Observation Notes; Corrective Action Notes; Reason Codes and Corrective Action Codes. Non-checkbox mandatory options such as note fields and attachments are colored in orange to make them more noticeable. Checkbox mandatory options are listed under the "Any Status" filter at the top right of the inspection screen and whenever there are mandatory items, an orange triangle icon will display at the bottom of the page. Your inspectors will get a notice stating, "Your inspection is incomplete. Please complete all mandatory items" if they try to exit the inspection screen before addressing the mandatory options. You select the mandatory options in Setup > Checklist Setup Process > Checkpoint > Checkpoint Options on each individual checkpoint.


- Project Setup Activity Log - You can now find changes made in your Project Setup area by reviewing the new "Activity Log" at the bottom of the Setup Menu. The scope of logging includes the project, the table affected, ID of records changed, user, date and type of change (add, update, and delete). This Activity Log will eventually include other Setup areas such as User Setup and Checklist Setup, but we're starting with the Project Setup area. Go to Setup > Activity Log to see the new feature.

REPORTS
- Query Q1029: Inspection Header Report - The Q1029 query report provides all header information related to inspections output (401 series reports). With this query, you can perform custom analysis, use the data to maintain a local database for custom reporting or merge into a corporate database. You can run the query from Reports > Run Reports Online. It is saveable as favorite report. However, it is currently not one of the reports you can schedule as an auto report. Output is in Excel format only.
- Open APIs using Q1025/Q1027/Q1029 data - FTQ360 Open APIs allow your IT departments to automatically retrieve FTQ360 data to update a local database; produce custom reports in Excel or a report writer and/or Integrate FTQ360 data into a corporate data lake. It requires an experienced IT person on the user side to setup the retrieval protocols. The APIs are setup to export FTQ360 inspection data corresponding with Q1025 checkpoint, Q1027 attachment, and Q1029 inspection header records. The API exported data includes inserts, updates, and deletes in the last 24 hours.
iOS APP
- iOS App Link to FTQ360 App - iOS device users with an iOS FTQ360 app installed can now click a link to an FTQ360 link in an email and it opens to the correct page FTQ360.net url from within an email and the App Links feature will open the FTQ360 app to the correct FTQ360 page/url.
MENU ADDITIONS
- Setup > Asset/Equipment Setup
- Setup > Activity Log (Project Activity Log)
JUNE/JULY/AUGUST 2019
Release date is 9/24/2019
INSPECTIONS
- Button Auto Options: You can now create "Button" selections for your inspectors to choose. Up until now, text added to the "Auto Options" field was displayed as a drop-down option on the inspection screen. Now, you can choose to make your Auto Options display as buttons.

- Custom formatting of notes entered on inspections: Inspectors can now use a basic HTML/Rich Text editor to change the appearance and add formatting to the notes on inspections. This will help highlight important information and make long blocks of text more readable. Bold, italic, underline, and bullets are available now. We'll be adding color and possibly font size changes in the future. Style options are limited to those that can be printed on PDF inspection reports.

- Current Date/time insert button on inspection HTML Editor - As part of our new HTML editor, you'll be able to insert the current date and time and current GPS using the new bottons available once you open the "Enter Observation" or "Corrective Action Notes" field.

- GPS insert button on inspection HTML Editor

- Custom matrix column widths on the Inspection (not PDF) - To help save space and make matrices more user friendly for the inspectors, you can set different column widths when you create the matrix in Checklist/Checkpoint Setup. Select the "Options" link on each row of your Dynamic Matrix and set one of 5 available widths. Currently, this feature is only available for formatting the inspection screen. The PDF output will still have the preset column widths.

- Add Prefilled Rows to your Dynamic Matrices - Whether you're a safety manager creating reusable JHAs, a quality manager creating a daily report with prefilled rows, or anyone with a need for a form-style inserted in your inspection checklists, you'll love this new feature. You'll setup the Prefilled Matrices using the Dynamic Matrix checkpoint type in Setup > Checklist Setup Process > Checkpoints. Add your columns and using the "+" on the far right of the screen as usual; give them a label and Save. Then, click the "Prefill" link under the "Options" column and click the "Add Prefilled Row" as many times as needed. Fill in your rows, Save and your "Form" will appear on the checklist inspection screen.

- 5 Customizable Key Metrics for Data Collection - Similar to our existing Risk Factor (R), you can now add and customize up to 5 key metrics for data collection for deficiencies. When an inspector clicks on the Open or FIXED/QC checkbox, the key metrics fields appear to the right of the "Due Date" field. Your default value will be displayed, but can be changed by the inspector. These data values are setup in Customization > Common Checklist Items > "Key Metrics". However, you can change them for specific checkpoints in Setup > Checklist Setup Process > Checkpoints (after selecting a checklist to edit). Common examples might be Cost, #Days Delay, OSHA Recordable Injury or Illness. You can add up to 5 of any type you want. The Key Metric data values can be specific to one Category or All Categories.


- Key Metric Data Query - Data queries Q901 and Q1025 both include your key metric data. If you have fewer than 5 custom key metrics, the additional query columns will include placeholders with the term "KeyMetric" as the column header.
DASHBOARDS
- Dashboard Landing Page ("View All Dashboards" menu option) - There's a new Dashboard Landing Page to organize all of the available dashboard options for you to select. The dashboards are organized by categories that can be filtered. Choose your Favorites by clicking the star in the dashboard box and these dashboards will be added to the top menu for easy selection.


- 6 New 3 Panel Dashboards - This release brings 6 new 3 panel dashboards. Several of these dashboards were requested by customers who need the data for their monthly reports to upper management. If you have a similar request, please let us know. We plan to continue to expand our list of dashboards to help our users show upper management what a great job they are doing and how FTQ360 is helping. Please call and request a demo if you'd like to learn more about these or any of our existing dashboards. Below are the 5 new dashboards.
USER SETUP/ACCT. MANAGEMENT
- Customize Home Pages for Different Users - Not every user is an Inspector who wants his or her home screen to be the Enter New Inspection screen. That's why we're letting you set the home screen for each user based on his or her Inspector Type that you assigned on the User Setup screen. Restricted users and users with no Inspect permission have their own home page setting, so please also consider these if you choose to customize the home pages of your users. Go to: Setup > Administration > Account Management and select "Home Pages" from the left-hand Process Menu. Once there, you can make your home page selections. Inspector Types are Preferences, so if you'd like to change or re-purpose some that we have preset, Go to: Setup > Customization > Customization Preferences and search for "Inspector Type". Edit the types as desired. Then check that your users have the appropriate Inspector Type. Go to: Setup > User Setup Process and review the column titled, "Insp. type". Refresh the screen if you don't see the changes made in Customization Preferences.

- More Free Users - We've expanded what are considered "Free" users to include all users that do not have "Inspect" or "Self Insp. Only" permissions. You can see your paid and free user counts on the Manage Subscriptions page. Go to Setup > Administration > Account Management and select "Manage Subscriptions". The User info is at the top of the screen. The example below shows "2" paid users, one with "Inspect" permissions checked and another with "Self Insp. Only" permissions checked.

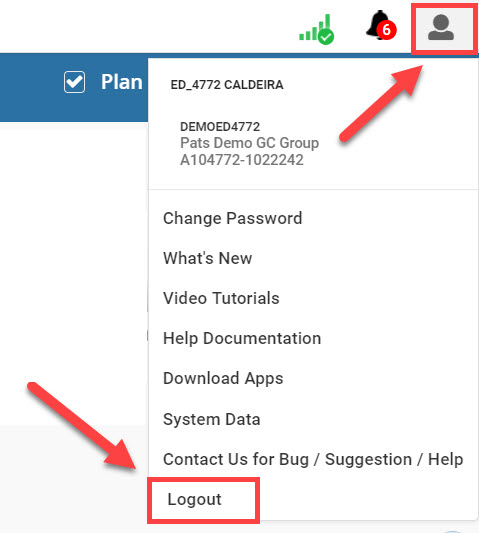
- ON/OFF New Inspector/User Setting - If you are like most of our advanced users, you have your projects setup just the way you want them and don't want your Project Inspectors to automatically change when you add a new user to your User Setup screen. You can now change your Preference setting to turn off this automatic activation of Inspectors. Go to Setup > Customization Preferences. Add the search term "user" to the search box on the top right of the screen. You'll see a Preference like this: 0 - auto-all Users/Project Inspectors activation is OFF, 1 - auto-all Users/Project Inspectors activation is ON. The default setting is "1", which is ON. So, change your preference to "0". With this preference set to OFF, you will then need to manually activate new Project Inspectors if you want them to be able to see and have access to a project. Logout and log back in for the new preference to be in effect (click the black profile icon on the very top right of your FTQ360 screen and choose "Logout")
- Change to the restricted user view on "View Recent Inspections" screen. Restricted users will no longer see inspections for which they are not either the Inspector or the Primary Responsible Party. Up until now, the View Recent Inspections screen also included inspections for which the restricted user was a responsible party for an open item. That will no longer be the case.
- Limit bulk file and file size uploads - to help prevent application crashes when uploading large files or large quantities of files and images, we've set a limit to no more than 10 files/images at one time with a 50 mb file size limit. If you do exceed these limits, you will see a message that says, "Up to 10 files can be uploaded at one time. Each file may be up to 50 MB. Please try again".
REPORTS
- 900 Series query reports - The Excel download for all of the 900 series reports is back in the form of Data Query reports. You can activate or deactivate Data Queries that are available to run in your Reports > Run Reports Online area. Go to: Reports > Activate Reports > select "Data Queries" on the left and check or uncheck the "Active" box.
Below is a listing of standard reports and their Excel formatted companion Data Query report.- Q900 = FTQ-900 OL-Inspection Data Table
- Q901 = FTQ-901 OL-Checkpoint Data Dump (last 31 days)
- Q902 = FTQ-902 Ol-Inspection Grid
- Q903 = MP-903 Deficiency History
- Q904 = FTQ-904 OL-ITP Progress Listing
- Q1025 - All checkpoints (expanded, up to 10,000 rows) with a full range of filters - Query 1025 uses your Customization Preferences for column headers and is great as an export to bring your FTQ360 data into 3rd party report and dashboard writers. Checkpoint data includes Reason Codes, Corrective Action Codes, and Key Metrics and will be updated as new checkpoint fields are added to FTQ360.

- Q1027 - Inspection Pictures and Attachments Listing - This query is similar to Q1022 but with additional columns of data and filtering options.

GENERAL IMPROVEMENTS
- Improvement to Mandatory Checkbox feature - In addition to existing functionality, users will now get a message when clicking the home icon (logo) & main menu to navigate away from the inspection. Clicking the "Add New Inspection" or "View All Inspections" link at the bottom of the inspection, and clicking a link within the user’s notification menu will also result in a warning dialog pop up.
- Categories have been added to the ITP Progress screen - The categories selected when you setup the checklists used on your ITPs will now display on the ITP Progress screen the same as they display on the inspection selection screen in Plan mode. This will provide a more consistent view for your inspectors and managers, and will also provide another option for filtering using the universal search at the top right of the ITP Progress screen.

- Image parameters unification - To avoid double compression and achieve the same compression regardless of the device sending the image to the server (e.g. iOS, Android and Web application images), we have restructured the current parameter-set and made the setting available in Customization Preferences. To change settings, Go to: Setup > Customization > Customization Preference and search for "image". Below is a screenshot of the default settings that you can change.

- Improved navigation for new matrices on inspections - Desktop and PC user can navigate to the next cell by pressing the Tab key. Tabbing in the last column begins a new row. Navigation in the opposite direction can be achieved by pressing Shift + Tab. The Return/Enter key adds a new line to the cell. On mobile devices with no Tab key, user can navigate to the next cell by pressing the Return/Enter key.
- Deficiency Dashboards (bottom grid) no longer has "FTQ" as an option - Changing the status of a deficiency from Open or QC/Fixed to FTQ must be done on the inspection where there is a warning before continuing.
- Dashboard chart scrolling - Replaces paging for large lists
MENU AND OTHER CHANGES
- No Caret displayed on Auto-options

- View All Dashboards Menu Addition

- Home Pages Menu Addition

- Key Metrics Menu Addition

What's Coming ...
- Data Security : Project Permissions, Simplified sharing
- Checkpoint features: Edit reference pic, and weather API insert
- Specialty Dashboards: Key Metrics, Reason codes, Customer suggestion (TBD)
- Integration: API/Customer access to FTQ data for custom reporting
- General: Reassign equipment between projects, Tweaks on recently released features
- Updates to the Android app
APRIL/MAY 2019
Release date is 05/20/2019
INSPECTIONS
- Mandatory Checkbox - Sometimes inspectors need a reminder that they have not done a thorough job completing an inspection. To remind your inspectors to go back and complete all important check items, you can now make any checkbox-style checkpoints mandatory. This includes the following checkpoint types: Quality, Quality Hotspot, Quality Deficiency, Safety, Safety Hotspot and Safety Violation as well as Dynamic Checkpoints and Dynamic Selection as long as the child checkpoints have the checkbox types listed above. Data, Image, and Score type checkpoints cannot be made "Mandatory".
REPORTS
- Filter your Data Query Reports - Data Queries have been moved to the Online Report Runner to provide filtering options. You can save your filtered Data Queries as Favorites, email them as you would any report (from the Report History page) and output to a standard Excel format for convenient data analysis.

CUSTOMIZATION PREFERENCES
- Different/Customizable Quality and Safety Checkbox text - Up until now, Quality and Safety Checkpoint check boxes displayed the same checkbox text. The default text for both types of checkpoints has been FTQ, FIXED, OPN, NA. You can now set different checkbox text for Quality and Safety. And, you can have the two types with different text on the same inspection if you'd like. The new default text for Safety checkpoints is SAFE, FAILED, OPEN, NA. You can change the default text in Setup > Customization Preferences. Search for "checklist" and change default text if desired.

- User Preference for Screen Pagination - The "50" row option has been eliminate. For most computers, displaying 50 rows created some unresponsiveness, so we've removed this option as a default. But, as with most thing in FTQ360, we give you the option to decide. Thus, if you really want to display more than 20 rows on your grids and setup screens, you can change the preferences. Go to Setup > Customization Preferences and search for "page". As with all preference changes, you must logout and log back in to see them.
- On/Off Responsible Party/Project Setting - If you are like most of our advanced users, you have your projects setup just the way you want them and don't want responsible parties automatically activated when you add a new responsible party to your Responsible Party Setup screen. Now, you can set your preferences so that this doesn't happen. Changing your preference setting to "0" (in the Term column) will turn OFF the "all Responsible Party 'Projects" activation" preference. With this preference set to OFF, you will then need to manually activate new responsible parties if you want them to be available for selection as the Primary Responsible Party (the responsible party on the top blue header of the inspection checklist screen).
Go to Setup > Customization Preferences. Add the search term "responsible" to the search box on the top right of the screen and set your preference to "0". You'll need to logout for the new preference to be in effect (click the black profile icon on the very top right of your FTQ360 screen and choose "Logout")
- Dashboard Filter Preference - All Project - There is a preference setting to allow viewing of "All Projects" or just individual projects on dashboards. Please note that if you have a lot of data on your dashboards, setting the filter to "All Projects" may cause the dashboards to loads slowly. Change preference to "0" to disable selection of all projects in dashboards, or "1" to enable selection of all projects in dashboards. The default preference is "1".
DASHBOARDS & LISTING SCREENS
- Sticky Filters cleared when browser tab is closed - Previously, you had to close your browser or log out to clear your filters, now when you close your browser tab, this will reset your screens back to their original default settings. This will only effect users working through a browser and will not affect iOS or Android App users.
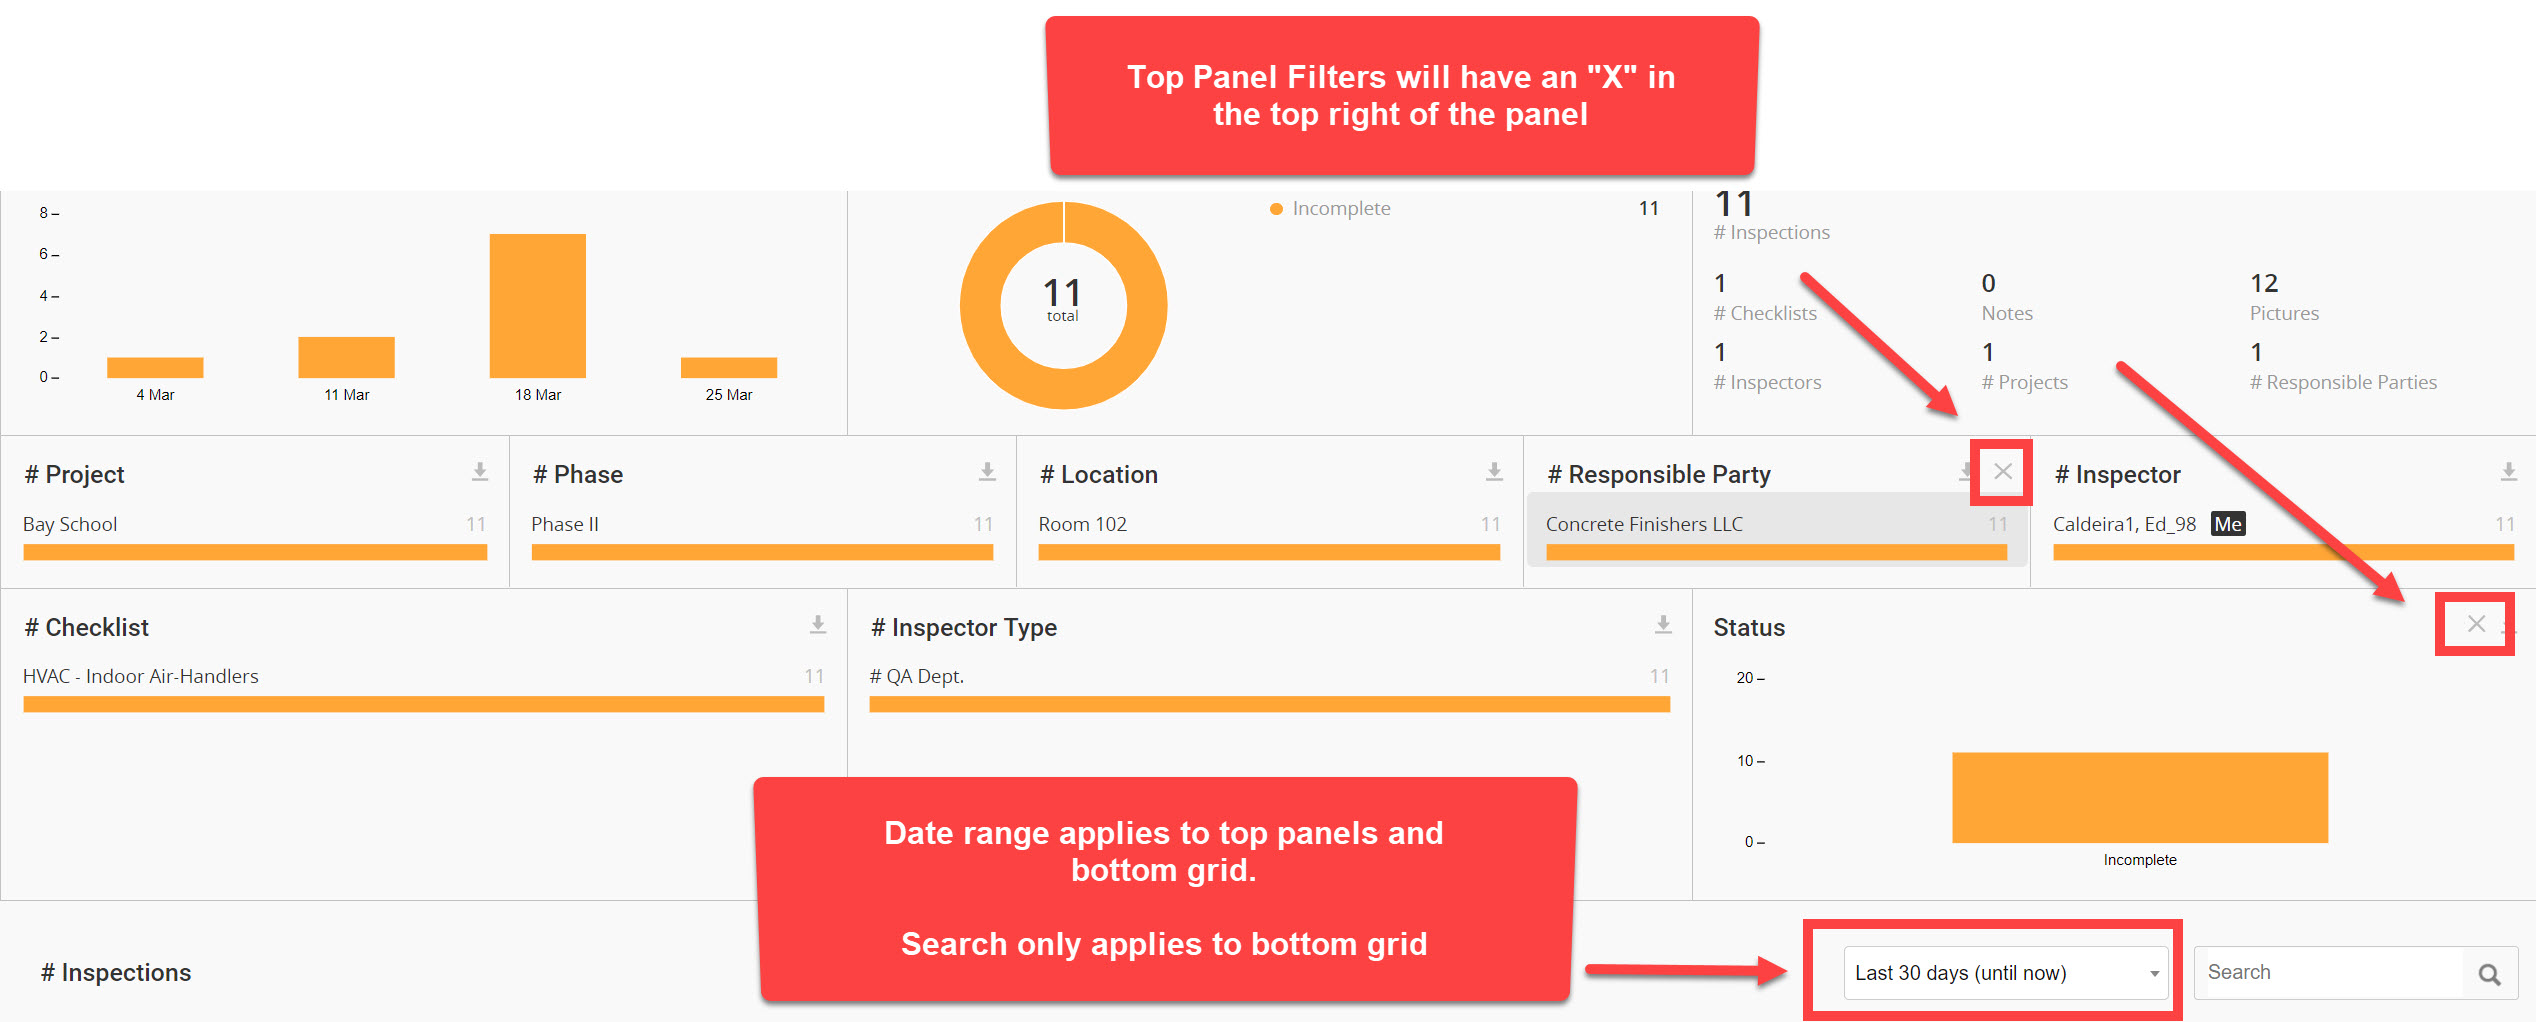
- Dashboard Filter Icon Change - In an attempt to make the filters you set easier to identify and clear, we've changed from the "X" to a more standard filter icon with a small red "x" next to it. Still, with all of the colors and data on the Dashboards, this little icon doesn't quite pop out at you, but hopefully this change will help a bit.
![]()
- Date Selector to top of Dashboards - The date picker is now at the top of the Dashboards. This will make it quicker to select date ranges rather than having to scroll down towards the bottom of the dashboard screen to choose a date range.
- Project Filter on top of Dashboards - You'll notice a new project filter drop down at the top of the Deficiency and Inspection Dashboards. Using this type of filter for project selections will provide some load time speed improvements. As a Customization Preference, you have the option to allow viewing of "All Projects" or just individual projects.

- ITP Progress Screen ordered by Phase/Job - It will now be easier to review your ITP progress. We've added a thin line to separate the items within each phase and changed the sort order so that the screen sorts first on your Phase/Job sequence numbers and then the plan items within each phase.

SETUP
- Dynamic Matrix Calculations (Sum, Avg & Count) - When using a Dynamic Matrix checkpoint, you can now set it up to calculate the sum or average of the numbers entered in any matrix fields or provide a count of the number rows with input in a field. If you choose to make a column a summary, average, or "count not empty" column, then FTQ360 will add a footer row to your matrix and it will display the calculated value(s).

- Add attachments to Location Setup - We've provided the option to add attachments to your locations. Just like you can currently add "Reference" material (File, Link, or Note) to your Projects, Phases, Checklists, and Checkpoints, you can now add these items to your Project or Phase Locations.

- Sticky Filters added to Setup Screens - When you return to one of the setup screens, FTQ360 will remember where you were and return you to that screen. For example, if you were in the Permissions area the last time you went to User Setup, then FTQ360 will take you back to that screen the next time you select User Setup Process on the Setup menu.
- To Clear filters - Close your browser tab.
- The following selections persist until cleared by the User or browser tab is closed:
- The page that you were on
- Button/Mode Filters- "All" selection (All, Active Only, Inactive Only)
- Universal Search box characters
- Sort order of grid columns
- Number of items to display per page (e.g. 5/10/20)
- Add a New Checklist
- Add a New Project/Community
- Add a New Phase/Lot
- Add a New Responsible Party
- ITP Setup Fields, "Not Set" changed to "Any" - To eliminate confusion, we've change the option, "Not Set" at the top of your ITP field drop downs to "Any". Columns with this option include: Phase, Location, Responsible Party, Equipment, Insp. Affiliation, and Insp. Type. When these columns say, "Any", then it means that "Any" selection will satisfy the requirement for the plan item. Thus, if the column for Location says "Any" and you have locations to choose from, any location chosen by your inspector will satisfy the requirement for this field.

MENU CHANGES
- Reports > Data Download Queries redirects to the Reports > Run Reports Online. Search "Query" for a list.
- Last Insp. column removed from Show Recent Inspections dropdown list
- Company Department List has been removed from Setup > Customizations because the company departments are listed on the Responsible Party Process setup screen.
GENERAL IMPROVEMENTS
- Browser tabs show correct page titles
- Dashboard Horizontal Graph Rendering Speed Improvement
FEB/MARCH 2019
Release date is 03/18/2019.
DASHBOARDS & LISTING SCREENS
- Sticky Filters - Inspection Listing Screens. With this first implementation of "sticky" filters, your searches, filters, sorts and page selections will persist on the inspection listing screens (under the "Inspect" on the main menu) until you clear them. Here are the details of this enhancement.

- Scope of listing grids includes:
- Sticky items include:
- Universal filter when applicable
- Column filters when applicable
- Column sort and direction
- Number of display items per page (e.g. 5/10/20/50)
- The page that they are on (e.g. page 6 of 23)
- Community selection filters in page header bar when applicable
- "Show" filter selection when applicable
- Sticky means same selections persist after:
- Refreshing browser tab
- Opening the same page in a new browser tab
- Using back button to return to the page
- Sticky is per screen. Sticky settings for one screen has no effect on other screens.
- There is NO "Reset all filters" at this time - Sticky filters are cleared after:
- You manually clear them (see Dashboard section below for clearing filters on Dashboards)
- Logout:
- Click the "Profile" icon on the top right of the screen and "Logout".
"Xing" out of the application DOES NOT log you out.
- Click the "Profile" icon on the top right of the screen and "Logout".
-
- Closing of browser application:
- Close (x out) ALL tabs in your browser, not just your FTQ360 tabs.
- Clearing of site cookies
- Clearing of browser cache
- Closing of browser application:
- Sticky Filters - Dashboards. Your searches, filters, sorts and page selections will persist on the Dashboards (under the "Dashboards" on the main menu) until you clear them. Here are the details of this enhancement.

- "Persist" means show the same results after:
- refreshing browser tab
- closing, then relaunching, browser tab
- navigating elsewhere in the app (including clicking inspection/deficiency links on the grid, as well us using the menu to navigate) and then returning to the Dashboard (whether with browser back button or using the menu to navigate)
- There is NO "Reset all filters" at this time - Sticky filters are cleared after:
- You manually clear them:
- Click the "X" in the Dashboard top panel filters to clear them. (see image below this section)
- Change the Date Range to clear date setting
- Delete "Search" if no longer applicable
- Adjust lower grid sorting if no longer applicable
- Logout:
- Click the "Profile" icon on the top right of the screen and "Logout".
"Xing" out of the application DOES NOT log you out.
- Click the "Profile" icon on the top right of the screen and "Logout".
- Closing of browser application:
- Close (x out) ALL tabs in your browser, not just your FTQ360 tabs.
- Clearing of site cookies
- Clearing of browser cache
- You manually clear them:
- "Persist" means show the same results after:
- Scope of Dashboards include:
- The following Dashboard selections persist until cleared or changed by the User:
- Selected data subsets for one or more widgets
- Data sort order and current page for each widget
- "Expand to see more" under the widget section
- Date drop-down selection
- Characters entered into search box where applicable (including when switching between Grid View and Calendar View)
- Grid/Grid view where applicable
- "Load more" (persist the number of rows displayed according to how often they clicked "load more")
- Column sort order
- Calendar view - selected date range where applicable
- Communities selector - Responsible Party Dashboard only
SETUP
- New Checkpoint Type: Compact 2-column: This new checkpoint type will let you create more compact reports. Rather than take up a whole line on a report this "Compact 2-column" checkpoint will display as half-width. The checkpoint type will not look different on the inspection entry screen, just on the printed report.

REPORTS
- Inspection Report - Grouping and sorting variations: There are additional inspection reports (401) grouped and sorted to be most useful depending on your needs. Activate the following reports as needed (Reports > Activate Reports, search 401):
- FTQ-401bx - Ordered by Project and Phase sequence
- FTQ-401cx - Ordered by Project and Location sequence
- FTQ-401dx - Ordered by Inspector
- Division Filter: You can now run reports by division without needing to individually select each project in a division. This is helpful for people using the "Divisions" field on the Project Setup Process screen. Select "Division" on the Run Reports Online screen.

DEC 2018/JAN 2019
Release date: 1/30/2019
MENU NAME CHANGES
- Dashboards
- Priority Open Item Dashboard has been renamed "Priority Deficiency Dashboard"
- ITP Planned Inspections Dashboard has been renamed "ITP Plan Completion Dashboard".
DASHBOARDS & LISTING SCREENS
- ITP Progress Dashboard - This new dashboard shows you what % complete your ITPs (Inspection & Test Plans) are. The ITP completion percentage is based on the minimum #of inspections planned and #of inspections that count towards meeting this requirement. The Status area shows you the status of the minimum # of required inspections, not the status of all inspections done. When more inspections have been done than the minimum required, you can look at the Inspection Activity section for this information. There is also a list at the bottom of the screen that displays inspection activity with a link letting you go directly to the inspection. Inspection Activity is broken into date range/time frames and the colored sections of the bars show you the status of the inspections. Status types include: Done, In Progress, In Progress Overdue, Planned Overdue and Planned. The overdue status can either come from plan item due dates or dependencies. When an inspection is done before it's dependency, then the dependent item will be shown as overdue.

- Aging Deficiencies Dashboard - This new dashboard shows you the age of deficiencies (open items) based on the time since the items were created. This is different from the Priority Open Item Dashboard that shows you deficiencies based on due dates. You can set 3 custom date ranges in Customization Preferences area. Our default is 7 days, 30 days and 90 days. While this information can be useful for all companies, it is especially useful for companies that do not close their open items (i.e. move from Open to QC or FIXED). Now, you can manage open items by age without managing due dates.

INSPECTIONS IN PLAN MODE
- Alert before starting a new inspection: When the minimum # of required inspections have been started, Inspectors will now see a popup alert asking them if they want to "Start a New Inspection" or "Go Back to Recent Inspections". This is only for ITP planned inspections because the system knows when the minimum required # has been met. Inspectors not working in Plan Mode on non-planned inspections, should rely on the colored icons to let them know prior inspections have been started and can use the "Show Recent Inspections" drop-down button to go to a previous inspection.

- Dependency Lock Icon: We've refined our new ITP "Dependency" feature by adding a "lock" icon to inspection selection screen if the dependent inspection item has not been done yet. In the first image below, the red arrow is pointing the the lock icon. In this example, "QA-Test Report Review and Acceptance" is required to be completed before the "Metal-Structural Steel Framing" inspection. The "QA-Test Report Review and Acceptance" is set as a Dependency for the "Metal-Structural Steel Framing" in the ITP section of the Project Setup Process area.

- Dependency Lock Alert: When an inspector clicks on/selects the item/inspection with a dependency, an alert will popup with a warning not to proceed. The inspection that should be completed first will be identified by its inspection plan item code. In the image above, [1015-3-8] at the end of QA-Test Report Review and Acceptance helps the inspector find the inspection he/she needs to do first.

INSPECTIONS IN STANDARD MODE
- ITP Plan Item Selection on Inspection Page - If you ever have inspections that are accidentally done through the standard selection mode when they were supposed to be done in Plan Mode, you can easily connect those inspections to the appropriate ITP plan item. There is now an additional field in the blue header on the inspection entry screen that will list any ITP Plan Items that match the inspection. If an inspection matches a plan item one-to-one, then it will automatically be assigned to the ITP. However, when there is more than one possible match, you'll need to manually assign. To find any unassigned inspections, you can use our new FTQ-485f Status Report (Unassigned Inspections), click on the link on the report to go to the inspection and select the appropriate plan item from the "ITP" drop-down.

- Customize your selection sequence order - You can set the preferred order for your standard and/or plan mode selection sequences. Project and Phase/Lot order will always be first. After that, you might want to show a list of locations or equipment before checklists or plan items. There is a separate preference setting for standard mode and ITP plan mode. See "Selection Order Preference" in Customization Preferences below for information on how to change your preferences.

SETUP
- On/Off New Checklist Activation - This is new preference for setting whether you want newly created checklist to be automatically activated on all Projects and Phases or no Projects or Phases. Currently, all newly created checklists are automatically activated on all Projects and Phases. Companies that have a lot of Phases (aka Jobs or Lots) with preset Phase Checklists have asked for this option. In some cases, manually activating new Phase Checklists where you want them is easier than deactivating them from where you do not want them. See Customization Preferences below for information on how to change your preferences.
REPORTS
- Compact Format - We've reduced the size of reports by approximately 25%. You may notice that the fonts are slightly smaller and there is less space between the rows.
- Matrix Style Improvements - The column width for matrices now adjusts for the number of columns. Previously, all matrices were displayed with a 12 column format. The new format make 3-6 columns 2x wider, 2 columns 6x wider, 1 column full width.

- Matrix Pass/Fail Field Color - On Matrix checkpoints, when displayed on reports, the row background color changes to appropriate color as noted below when any matrix item contains one of the terms. The feature is not case sensitive, but the field must contain the one of the exact words below and cannot have additional text.
- Green background when text begins with pass / accept / good satisfactory / OK
- Red background with text begins with fail/ reject / bad.

- Preference for 4 or 2 Images per row: If you need a more compact report and include a lot of images, you can now set a preference to have your reports include either "2" (the current standard) or "4" images across per row. This preference will affect all of your reports, (Immediate Notification, Run Online, & Auto-reports). See Customization Preferences below for information on how to change your preferences.
FOUR ACROSS

TWO ACROSS

- New ITP(485 series) Reports: There is a new series of ITP reports (project status, overdue items, incomplete items, and unassigned items). Only active projects are included in these reports.

CUSTOMIZATION PREFERENCES
- On/Off New Checklist Activation (Feature): Search for "auto-all" to set your preference for whether newly created checklists are assigned to all projects or no projects.
- 0 - auto-all Checklist "Projects" activation is OFF, 1 - auto-all Checklist "Projects" activation is ON. When OFF, you must activate the newly created checklists on your selected projects and phases.
- Default is set to "1".
- On/Off New Checklist Activation
- 0 - auto-all Checklist "Projects" activation is OFF, 1 - auto-all Checklist "Projects" activation is ON. When OFF, you must activate the newly created checklists on your selected projects and phases.
- #of Images Preference on Reports - Search for "images" to set the number of images you'd prefer on your reports.
- Number of images per row in Inspection and Deficiency reports. Valid values are 2 and 4.
- Default is set to "2"
- Default is set to "2"
- Preference for 4 or 2 Images per Row on Reports
- Number of images per row in Inspection and Deficiency reports. Valid values are 2 and 4.
- Selection Order Preference - Search for "Steps Sequence" to set your preference for the selection order for both the "Standard" selection process and the "Plan Mode" selection process.
-
Standard Mode: 1-LCVE, 2-LECV, 3-CLVE, 4-ECLV, 5-ELCV (L-Location, C-Checklist, E-Equipment, V-Vendor) Steps Sequence.
-
The default for the "Standard" selection process is "1" (Location, Checklist, Vendor aka Responsible Party or Subcontractor, Equipment)
-
-
Plan Mode: 1-LPVE, 2-LEPV, 3-PLVE, 4-EPLV, 5-ELPV (L-Location, P-PlanItem, E-Equipment, V-Vendor) ITP Steps Sequence
- The default for the "Plan Mode" selection process is "3" (Plan item aka Checklist, Location, Vendor aka Responsible Party or Subcontractor, Equipment)
- Set the Selection Order Sequence
-
- Aging of deficiencies on Aging Deficiency Dashboard - you can change the aging date ranges. You have the possibility of 3 aging ranges as defined below. Search for "Age of deficiencies" Customization Preferences to change the default ranges.
-
7 - Age of deficiencies in the green band on Aging Deficiencies dashboard. Default is 7 days.
-
30 - Age of deficiencies in the orange band on Aging Deficiencies dashboard. Default is 30 days.
-
90 - Age of deficiencies in the red band on Aging Deficiencies dashboard. Default is 90 days. Older items will be placed in the purple band.
-
Set the Date Ranges for the Aging Deficiencies Dashboard
-
- Shared Inspection - for companies connected to other FTQ360 accounts through the "Sharing" feature, you can set a preference of whether you want the "share" box on inspections preset to checked or unchecked. Search for "share" to change your preference.
- 1 - Inspection will be defaultly shared after creation. 0 - Inspection will be not shared after creation
- Default is set to "1"
- 1 - Inspection will be defaultly shared after creation. 0 - Inspection will be not shared after creation

IMPROVEMENTS/FIXES
- Updates for dictionaries - speed improvement
- Keep user selected after Login Invitation is sent
Comments
1 comment
What's New for September/October/November has been published and the features have been added to this page.
Article is closed for comments.